Indecision Candlestick Patterns
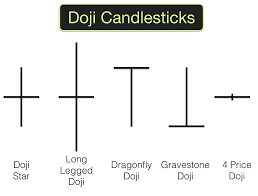
Not all candlesticks or candlesticks patterns hint at a directional change or a continuation of the current direction. Some candlestick formations indicate indecision candlesticks patterns on the part of traders. Like Doji
The Doji Pattern
When the closing price of a stock, currency, or commodity is equal or nearly equal to its opening price, the resulting candle is referred to as a ‘‘doji.’’ A doji candle has no real body; it consists of a horizontal line that indicates the price range of the measured time period, and a vertical line that represents both the opening and closing price.


The doji is often mistakenly referred to as a reversal candle. In truth, it only indicates indecision. While indecision could lead to a reversal, when viewed alone it is neither a reversal candle nor a continuation candle. It simply indicates that a battle between bulls and bears has ended in a draw.
The Dragonfly Doji

A dragonfly doji has similar opening and closing prices, which occur at the upper end of the candle’s range. It also has a long bottom shadow or wick, indicating that a push lower by the bears was rejected. The meaning of the dragonfly doji depends on its context.

For example, if this formation appears on a downtrend, it could act as a reversal candle in a similar fashion to a hammer. On the other hand, in a sideways or range bound market, the dragonfly doji simply represents indecision. As always with candlesticks, location is everything.
The Gravestone Doji
A gravestone doji has similar opening and closing prices that occur at the lower end of the candle’s range. It also has a long upper shadow or wick, indicating that a push higher by the bulls was rejected.

As with the dragonfly doji, location is everything. In an uptrend, the effect of the gravestone doji could be similar to that of a shooting star pattern, as it is indicative of a bullish thrust that met with rejection.
In a sideways or range bound market, the gravestone doji candlestick merely represents indecision.
The Spinning Top
The spinning top candle is similar to a doji in that it represents indecision; however, this candle’s opening and closing prices are not the same. Instead of representing both the open and close with a thin horizontal line, the spinning top candle possesses a small real body.

The color shading of the real body is irrelevant. This candle has upper and lower shadows or wicks. These wicks indicate that
a battle between bulls and bears had no decisive victor. Like the doji candle, the spinning top represents indecision.
a battle between bulls and bears had no decisive victor. Like the doji candle, the spinning top represents indecision.
High Wave Candle

The high wave candle is similar to a spinning top candle, in that it has a small real body. The difference lies in the high wave candle’s longer wicks, which are an indication of high volatility.
In a high wave candle, both the bulls and bears were able to move the price substantially, but neither side could maintain control.
So we can say not every candlestick on a chart contains meaning. If you find yourself examining and analyzing each and every candlestick on the chart, you run the risk of assigning meaning to a candle that simply isn’t significant. This leads to a condition technicians refer to as ‘‘paralysis by analysis.’’ Instead of over analyzing each candlestick, examine the charts with an open mind and wait for a pattern to present itself to you


behtar samajh aaya